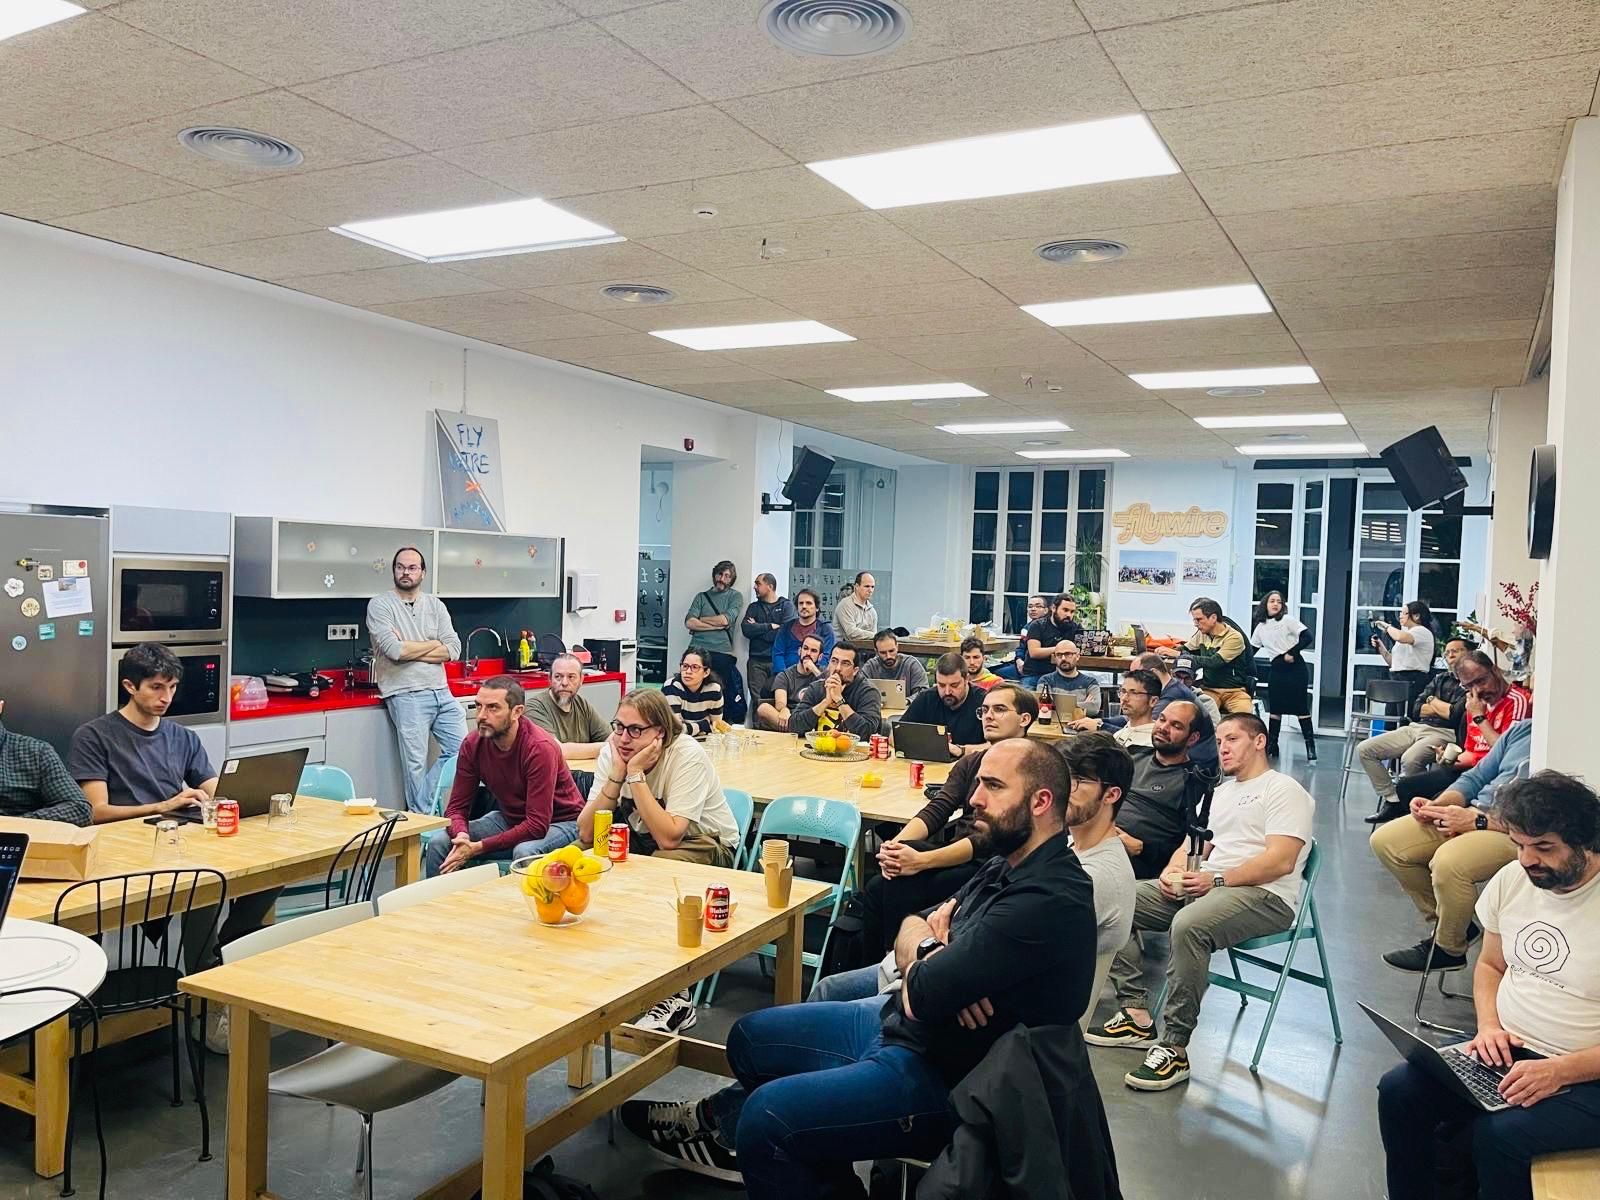

On the January 23rd I had the chance to be the 1st speaker of the Cloud Native Valencia community group.
It was a great meetup with a lot of engaged folks and the setup was a bit different than usual meetups. When Jade Lassery reached out to me, she asked if I could prepare a hands-on lab to run together with the talk. As I rarely say “no” to OpenTelemetry topics, I accepted right away!
For that, I had a 1h30m slot, and we went through OTel basics plus a hands-on lab where the community could follow the steps together with me.
The Presentation#
The presentation went really smooth, and there were a couple of folks from Flywire there (the hosts of the event), and they are already using OTel in production, which just adds-up to the message that OTel is a good choice.
Slides are shared at the bottom
The Lab#
When planning the lab, I made sure to validate and document each step, so if there were any hiccups, nobody would be left behind.
I had some folks following along with me, which was great to have instant feedback on what we were doing.
You can also take a look at the hands-on lab and let me know what you think.
Here is the link of it again: hands-on lab.
As this was a Cloud Native Community Group I wanted to make sure I only presented Open Source tools, and about 2 weeks before the presentation I came across the Aspire Dashboard.
This is a new OSS project from the .NET community and the tool supports
OTLP (OpenTelemetry Protocol) directly, so I could simply add it to my
compose file and have a repository containing only the app, an OTel
Collector, Jaeger and Aspire.
I didn’t need to have Jaeger, but I’m a huge fan of the tool and wanted to share it as well. Also, with 2 tools to visualize traces, I could showcase how we can use a Collector to fan-out telemetry data to multiple backends.
Q&A#
After running the lab , we had a round of Q&A and I got asked 2 questions which I didn’t know the answer. I took them as homework and, even though, I still don’t have answers, here are my findings:
After some digging I found the following:
Presets in the OTel Operator#
As of today it seems that presets in the OpenTelemetry Operator is not planned, but I’d encourage users commenting on this operator issue.
This would raise the awareness of maintainers to a feature that would improve usability to end users.
Resilience#
I’ve been contributing to OTel and consuming a lot of OTel stuff in the last 4 years, but I’ve never heard, nor explored the fact that the Collector is also a piece of software, and it CAN CRASH.
The user wanted to know what happens when the Collector dies, and what can be done to ensure no data is lost.
I knew that the SDKs have some retry mechanism when they can’t reach the Collector, but what happens when the data is sent to the Collector successfully, but the Collector crashes?
I assumed that it wasn’t possible, because (again) I never heard of anybody talking about that. I then nudged a colleague and he pointed me the right direction, thanks @mx-psi.
It happens that there is some work in progress and currently we can set up a persistent queue and use a storage extensions like the redis storage extension, to have some sort of queuing.
However, I’ve tried it out and hit a wall, I tried using the following Collector configuration:
extensions:
  file_storage: {}

receivers:
  otlp:
    protocols:
      grpc:
        endpoint: ${env:OTEL_COLLECTOR_HOST}:${env:OTEL_COLLECTOR_PORT_GRPC}
      http:
        endpoint: ${env:OTEL_COLLECTOR_HOST}:${env:OTEL_COLLECTOR_PORT_HTTP}

processors:
  batch:
    timeout: 30s

connectors:
  spanmetrics: {}

exporters:
  debug: {}
  otlp:
    endpoint: "aspire-dashboard:18889"
    tls:
      insecure: true
    sending_queue:
      storage: file_storage
  otlp/jaeger:
    endpoint: "jaeger:4317"
    tls:
      insecure: true
    sending_queue:
      storage: file_storage

service:
  extensions: [file_storage]
  pipelines:
    traces:
      receivers: [otlp]
      processors: [batch]
      exporters: [debug, otlp, otlp/jaeger, spanmetrics]
    metrics:
      receivers: [otlp, spanmetrics]
      processors: [batch]
      exporters: [debug, otlp]
    logs:
      receivers: [otlp]
      processors: [batch]
      exporters: [debug, otlp]
Note that I’ve configured the batch processor to have a 30s timeout.
Also note that in my case I haven’t used the redis storage just to
keep it simple.
With that set, I’ve created a shell script to send 100 requests to my API endpoint.
And after running the shell script, I’ve waited a couple of seconds (just to make sure the Collector received all data from the services), and killed the Collector.
One thing that I’ve noticed, was that the persistence of the data in the
file_storage was happening just after the exporting, what is basically
useless in the scenario we are testing.
The Collector receives the data, we kill the Collector, the Collector dies without persisting anything. When a new Collector is started, it is not aware of the lost data, and just moves on with it’s “life”.
After doing a couple of other tests, I’ve decided to open an issue on the Collector repository and try to see if I was doing something wrong.
I’ve opened the issue #37843, and got an update from the code
owner of the extension/storage/filestorage component: @swiatekm.
The issue on my case is that I’m using the batch processor, but as most
of users also use it (as it is highly encouraged to reduce network overhead),
I still believe we have an issue here.
The team is working on another batching option that would work with the exporter helper, this may solve the issue for real, but we still need to wait and see how that develops.
Or, of course, if you have time and is willing to contribute, just join the Collector SIG meeting, and/or talk with folks on the Collector Contrib repository to help develop the solution.
Everyone is always welcoming and super friendly.
They are also keeping track of reliability of the Collector in this issue. If you are interested and have other concern points to highlight, jump in and let the team know.
The more we raise awareness of the issues, the better we can tackle them as community.
While doing the research on that, I also came across a talk from my long time friends Yuri Oliveira Sá and Juraci Paixão Kröhling: Building Resilient Observability Pipelines in Kubernetes with OpenTelemetry Collector.
I highly recommend watching the talk.
Thanks#
I’d like to wrap-up thanking the Cloud Native Valencia team for organizing such a great event, for everyone whom attended and followed along, and a special thanks to Jade for the invite.
Hope to see y’all around, and happy OpenTelemetrying!
Slide deck: